
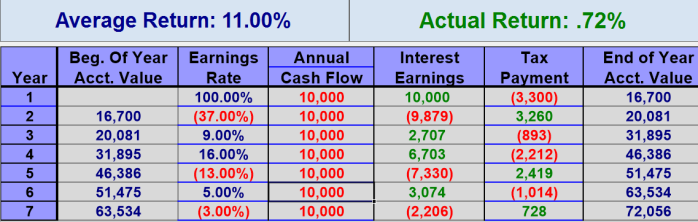
It is imperative to understand the difference between average rates of return and actual rates of return. In the financial word this is known as Compound Annual Growth Rate (CAGR) or Real Rate of return. Understanding the difference between these two will help you understand why so many people do not realize the returns or the gains that they expected in terms of the real dollars that they accumulate. Much of the financial world speaks in terms of average rates of return. The problem is, that average returns do not determine how much of your money you get to keep at the end of the journey. In the real wold, it is the actual rate of rate (CAGR) that determines what you end up with. When you participate in all of the losses in the down years, it has an enormous affect on the actual dollars you will save.
Note, all of the returns below are BEFORE the eroding effects of taxation or management fees. This substantially reduces the actual or REAL rate of return that one receives on their savings.
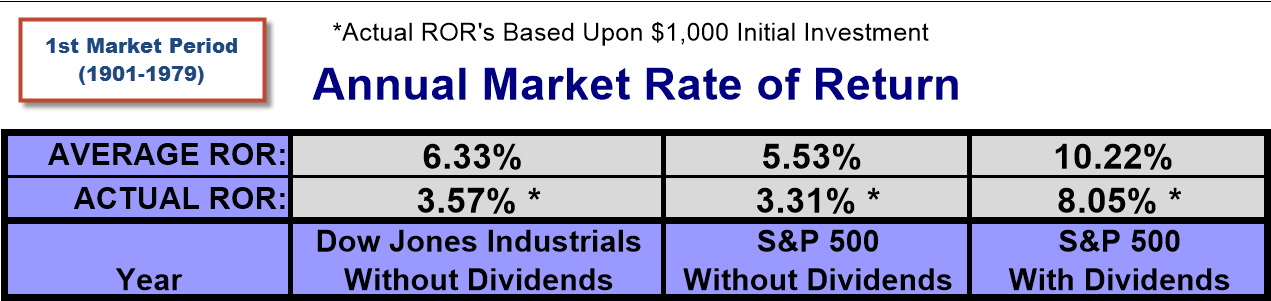
During the first market period the actual rate of return on an initial lump sum investment from 1901-1979 would have given you an actual rate of return of 3.57% (Down Jones)
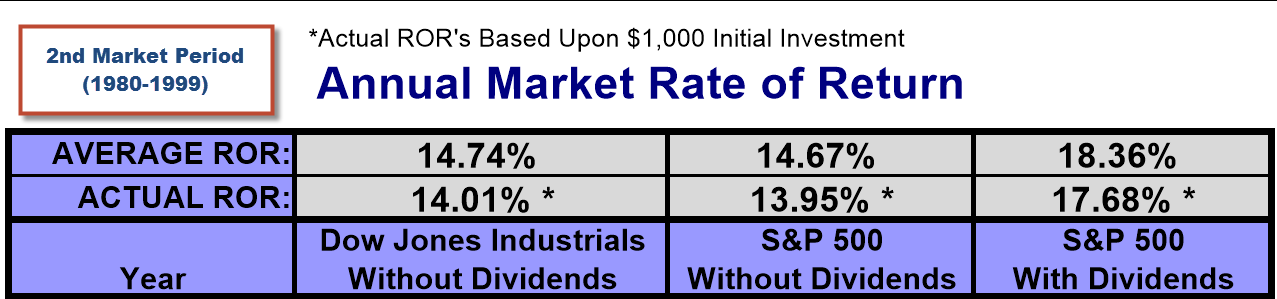
The second market period was the longest running bull market in the history of the markets. There were two key events that caused such growth. The primary reason was the introduction of the qualified plan (401k). For the first time in history millions of Americans were dumping there money in the stock market via payroll deductions and yet were provided NO guarantees. This meant that hundreds of millions of dollars were flooding into the market. There is a direct correlation between the introduction of the 401k and the sharp increase in market growth during this market period. Prior to this point, the majority of Americans were not speculating on Wall Street. In fact, in the 1950’s approximately just 3% of Americans owned common stocks.
The other major event that had a drastic impact on this market period was the disconnect of Gold from the Dollar. This single act by Richard Nixon removed all restraints on our Government’s ability to print currency via The Federal Reserve. This practice continues today as evidenced by the $85 Billion per month in new us dollars being pumped into the banking system by The Federal Reserve. These actions by our Central Bank directly impact the stock markets. Much of the current stock market values since 2008 are solely due to the Federal Reserve engaging in unprecedented “money printing”. It is an asset bubble of epic proportions. This has drastically inflated the stock markets.
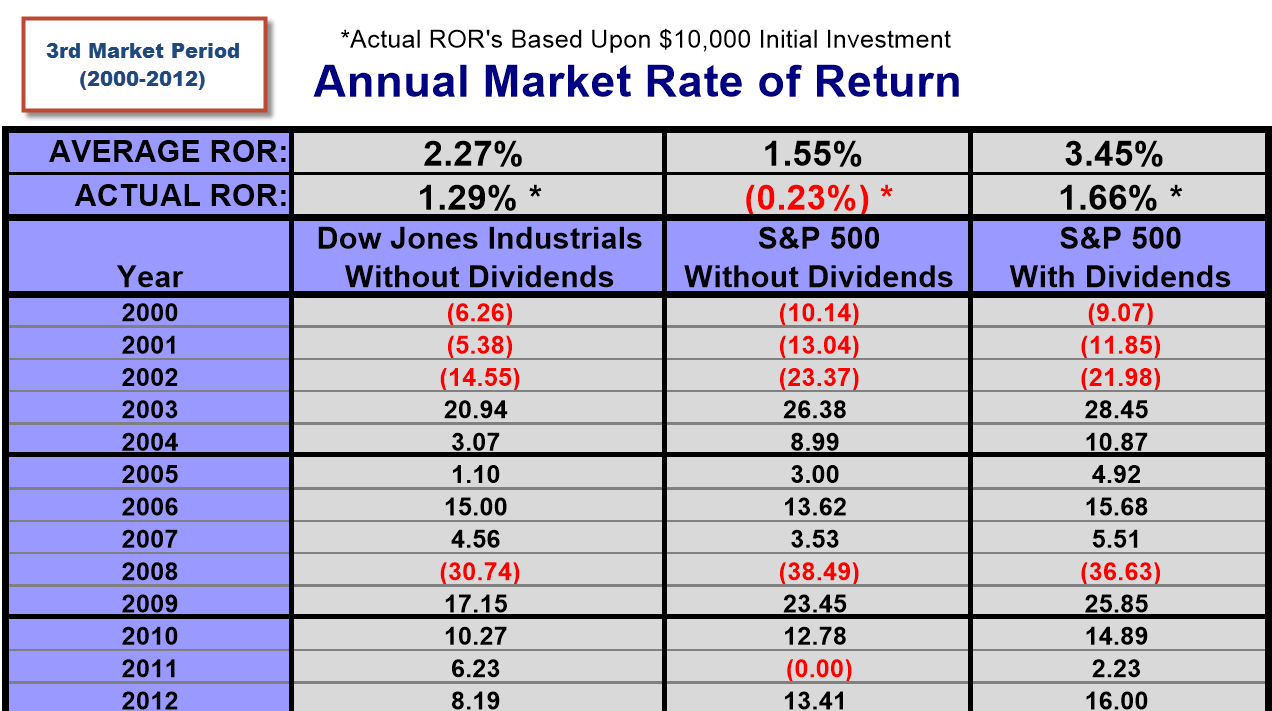
The third market period is very telling. Many people have already forgotten 2008. Participating in market losses has an enormous negative impact on your savings. If one had all of the life savings in the sock market let’s hope they weren’t planning on retiring in 2008! What if they were forced to access their money in a down year? Gains are only paper gains until you liquidate.
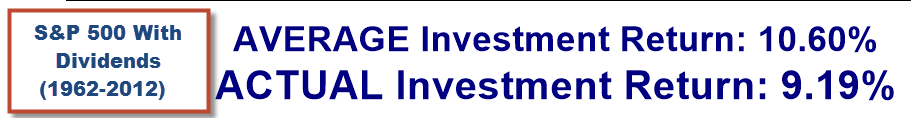
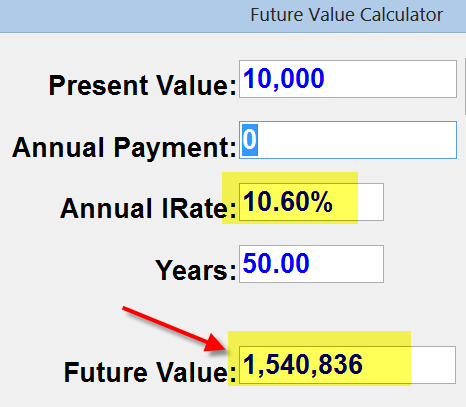
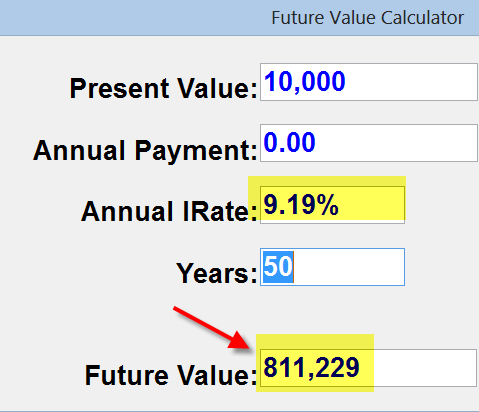
Below is the S & P 500 (with Dividends) for the last 50 years (1962-2012) At first glance you might think that the there’s no big difference between the Average and ACTUAL rate of return. Let’s assume that a $10,000 lump sum was invested from 1962-2012 which results in an average rate of return of 10.6% and an ACTUAL ROR of 9.19% during this 50-year period. This would mean you end up with $811,229 (before fees and taxation). If you received a REAL rate of return of 10.6% (vs. Actual 9.19%) during this time period, you would end up with: $1,540,836!! That’s a difference of: $729,607!! This is validated with a simple future Value financial calculator (see below)
Lastly, if this same $10,000 lump sum was invested from 1962-2012 and a person was in the 33% marginal tax bracket during this period, (assuming this asset were a 401k with deferral of income taxes) it would reduce their ACTUAL rate of return to: 6.47% which would mean you would end up with just: $230,035!! This is a far cry from the $1.5 million that the 10.6% average that so many confuse with Real returns. Therefore the 10.6% average rate of return after taxation resulted in $230,035 real dollars that you could spend, NOT $1.5 million. What if this account were subject to management and market based fees? If we assume just 1.5% in fees (see The Hidden Cost of Doing Business, and The Hidden Cost of Mutual Funds) then the REAL rate of return falls to: 5.37% in which case the 10.6% average rate of return would provide you just $136,929. If you received a REAL rate of return of 10.6% vs. Actual 5.37% (based on assumption above) during this time period, you would end up with: $1,540,836!! NOT the $136,929 (Actual Rate of Return).
Also SEE related: The Number Twelve
If you would like David to provide a free portfolio risk and returns analysis of your portfolio. Please contact us at: 501-218-8880
David can be reached at: David@DavidLukasFinancial.com