
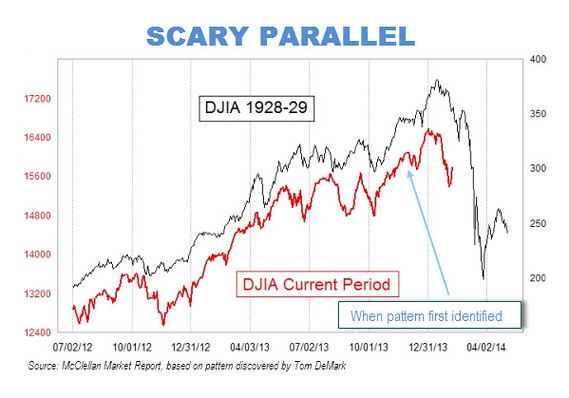
Are the fundamentals sound? Or is Wall Street high on Easy Money? This week David talks about the recent chart that has been making the rounds on Wall Street. The chart superimposes the market’s recent performance on top of a plot of its gyrations in 1928 and 1929. (See chart to right). Listen to David explain about how the stock market is volatile, and why the potential consequences for not taking action can be devastating, if you are someone who keeps their money in the Wall Street Casino.
David talks about Hulbert’s article, Scary 1929 Market Chart Gains Traction Hulbert, of Marketwatch.com, discusses the chart that has been circulating and gaining traction with market speculators.
David Plays a clip (see video below) where the commentator refers to Janet Yellen as a “Heroin dealer”, not in the literal sense, but as heroin referring to the billions of dollars in money printed out of thin air . One may scoff at this comparison, but in reality, it makes a lot of sense. The market is addicted to the fed’s printing (heroin). If the addict (Wall Street) stops getting it’s heroin (endless billions printed from nothing) then we will see a major decline in the stock market. The Fed is on the record of stating that when economic conditions warrant they will wind down Quantitative Easing (printing trillions of dollars with nothing of value behind them). This is like a heroin addiction, saying I’ll stop shooting up heroin as long as I stay high. The problem is, the drug is what is keeping the addict high. It is a certainty, that the addict will need more and more of the drug (easy money) to stay high. The problem is, the drug, is not addressing the addict’s REAL issues and continued use of the drug will not fix the addict’s problems. There is NO good outcome. What the addict needs, is to face the facts and deal with the root cause their problem.
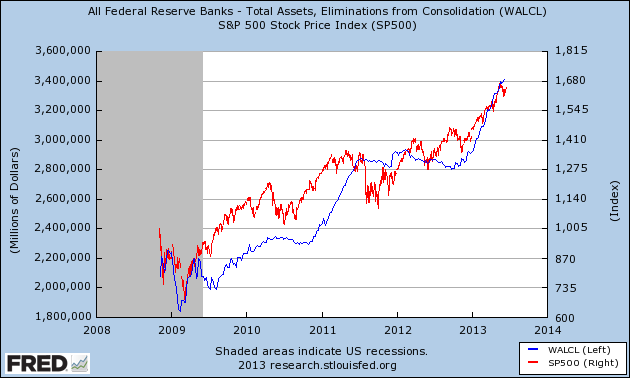
As the Fed keeps printing money, the market is being continuously inflated by the continuation of the Fed’s love affair with the printing presses. See the chart below directly from The Federal Reserve. The blue line represents the volume of asset purchases (money printing) by The Fed. The red line is the S & P 500 performance.
Also See: Billionaires Dumping Stocks, Economist Know Why
Watch Dr. Bob Murphy talk about the effects of Quantitative Easing and it’s affects on the markets. This is an excerpt from the Banking With Life Documentary. If you want to know what is really going on (and what to do about it), you can get your hands on this resource at a discount by going to the David Lukas Show Online Store.
Additional Resource: Read David’s book, Whose Future Are You Financing?
David and his team help their valued client all over the united states. David and his firm David Lukas Financial can be reached by calling: 800-559-0933
Next Week: David talks with David McKnight, author of The Amazon #1 best-selling book: The Power of Zero. How To Get To The Zero Percent Tax-Bracket and Transform Your Retirement.